Here is an Euler diagram to represent a simple solution of Monty Hall problem:
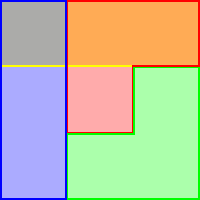
Comparing the blue region ("the case when the player persists in the initial choice") with the red one ("the switch case") shows that the latter is twice as likely to win the prize (yellow) as the former.
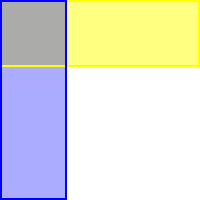
The above diagram is derived by considering a stranger randomly choosing a door. He is not the player nor the host, and has no clue at all about the fuss of the problem. Let \(X\) be the door of his choice. Call the door of prize \(C\) ("car"), the door that the player initially chooses \(I\), and the one that the host opens \(H\).
Then, it is easily seen that\begin{align}P(X = C) &= \frac{1}{3}\\P(X = I) &= \frac{1}{3}\\P(X = H) &= \frac{1}{3}.\end{align}
Moreover, as events \(X = C\) and \(X = I\) are independent,\[P(X = C, X = I) = P(X = C) P(X = I) = \frac{1}{9}.\]
Because \(X = C\) (or \(X = I\)) and \(X = H\) are mutually exclusive,\begin{align}P(X = C, X = H) &= 0\\P(X = I, X = H) &= 0.\end{align}
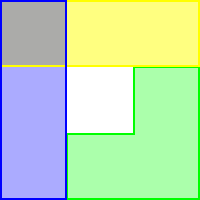
The rest follows from noting that \(X\) is the switchable door iff \(X \neq I\) and \(X \neq H\).